通过性能分析了解torch.compile的性能
torch.profiler的使用场景:
torch.profiler 有助于从内核级别详细地分析程序的性能,例如,它能展示程序级别的图中断和 GPU 利用率。Profiler 提供的数据通常能够帮助用户确定进一步调查的方向,以便更好地理解模型的性能。
要理解内核级别的性能,还有其他工具可供使用。可以考虑 NVIDIA 的 ncu 工具,或者参考 inductor 的 profiling 工具。
使用torch.profiler的基本方法和查看追踪记录
示例程序:我们将通过一个对 resnet18 进行性能分析的例子来进行说明。请特别注意该示例程序中的以下部分:
-
包括一次预热运行,等待编译完成(这样可以预热系统,如CUDA缓存分配器)
-
使用
torch.profiler.profile()上下文来 profiling 我们感兴趣的代码段 -
使用
prof.export_chrome_trace("trace.json")导出性能分析结果。
import torch
from torchvision.models import resnet18

model = resnet18().cuda()
inputs = [torch.randn((5, 3, 224, 224), device='cuda') for _ in range(10)]

model_c = torch.compile(model)

def fwd_bwd(inp):
    out = model_c(inp)
    out.sum().backward()

# warm up
fwd_bwd(inputs[0])

with torch.profiler.profile() as prof:
    for i in range(1, 4):
        fwd_bwd(inputs[i])
        prof.step()

prof.export_chrome_trace("trace.json")
查看 Chrome 跟踪记录: 在 Chrome 浏览器中,打开 chrome://tracing 并加载 JSON 文件。使用“w”和“s”键进行缩放,“a”和“d”键左右滚动。“?”键将显示包含快捷方式列表的“帮助”页面。
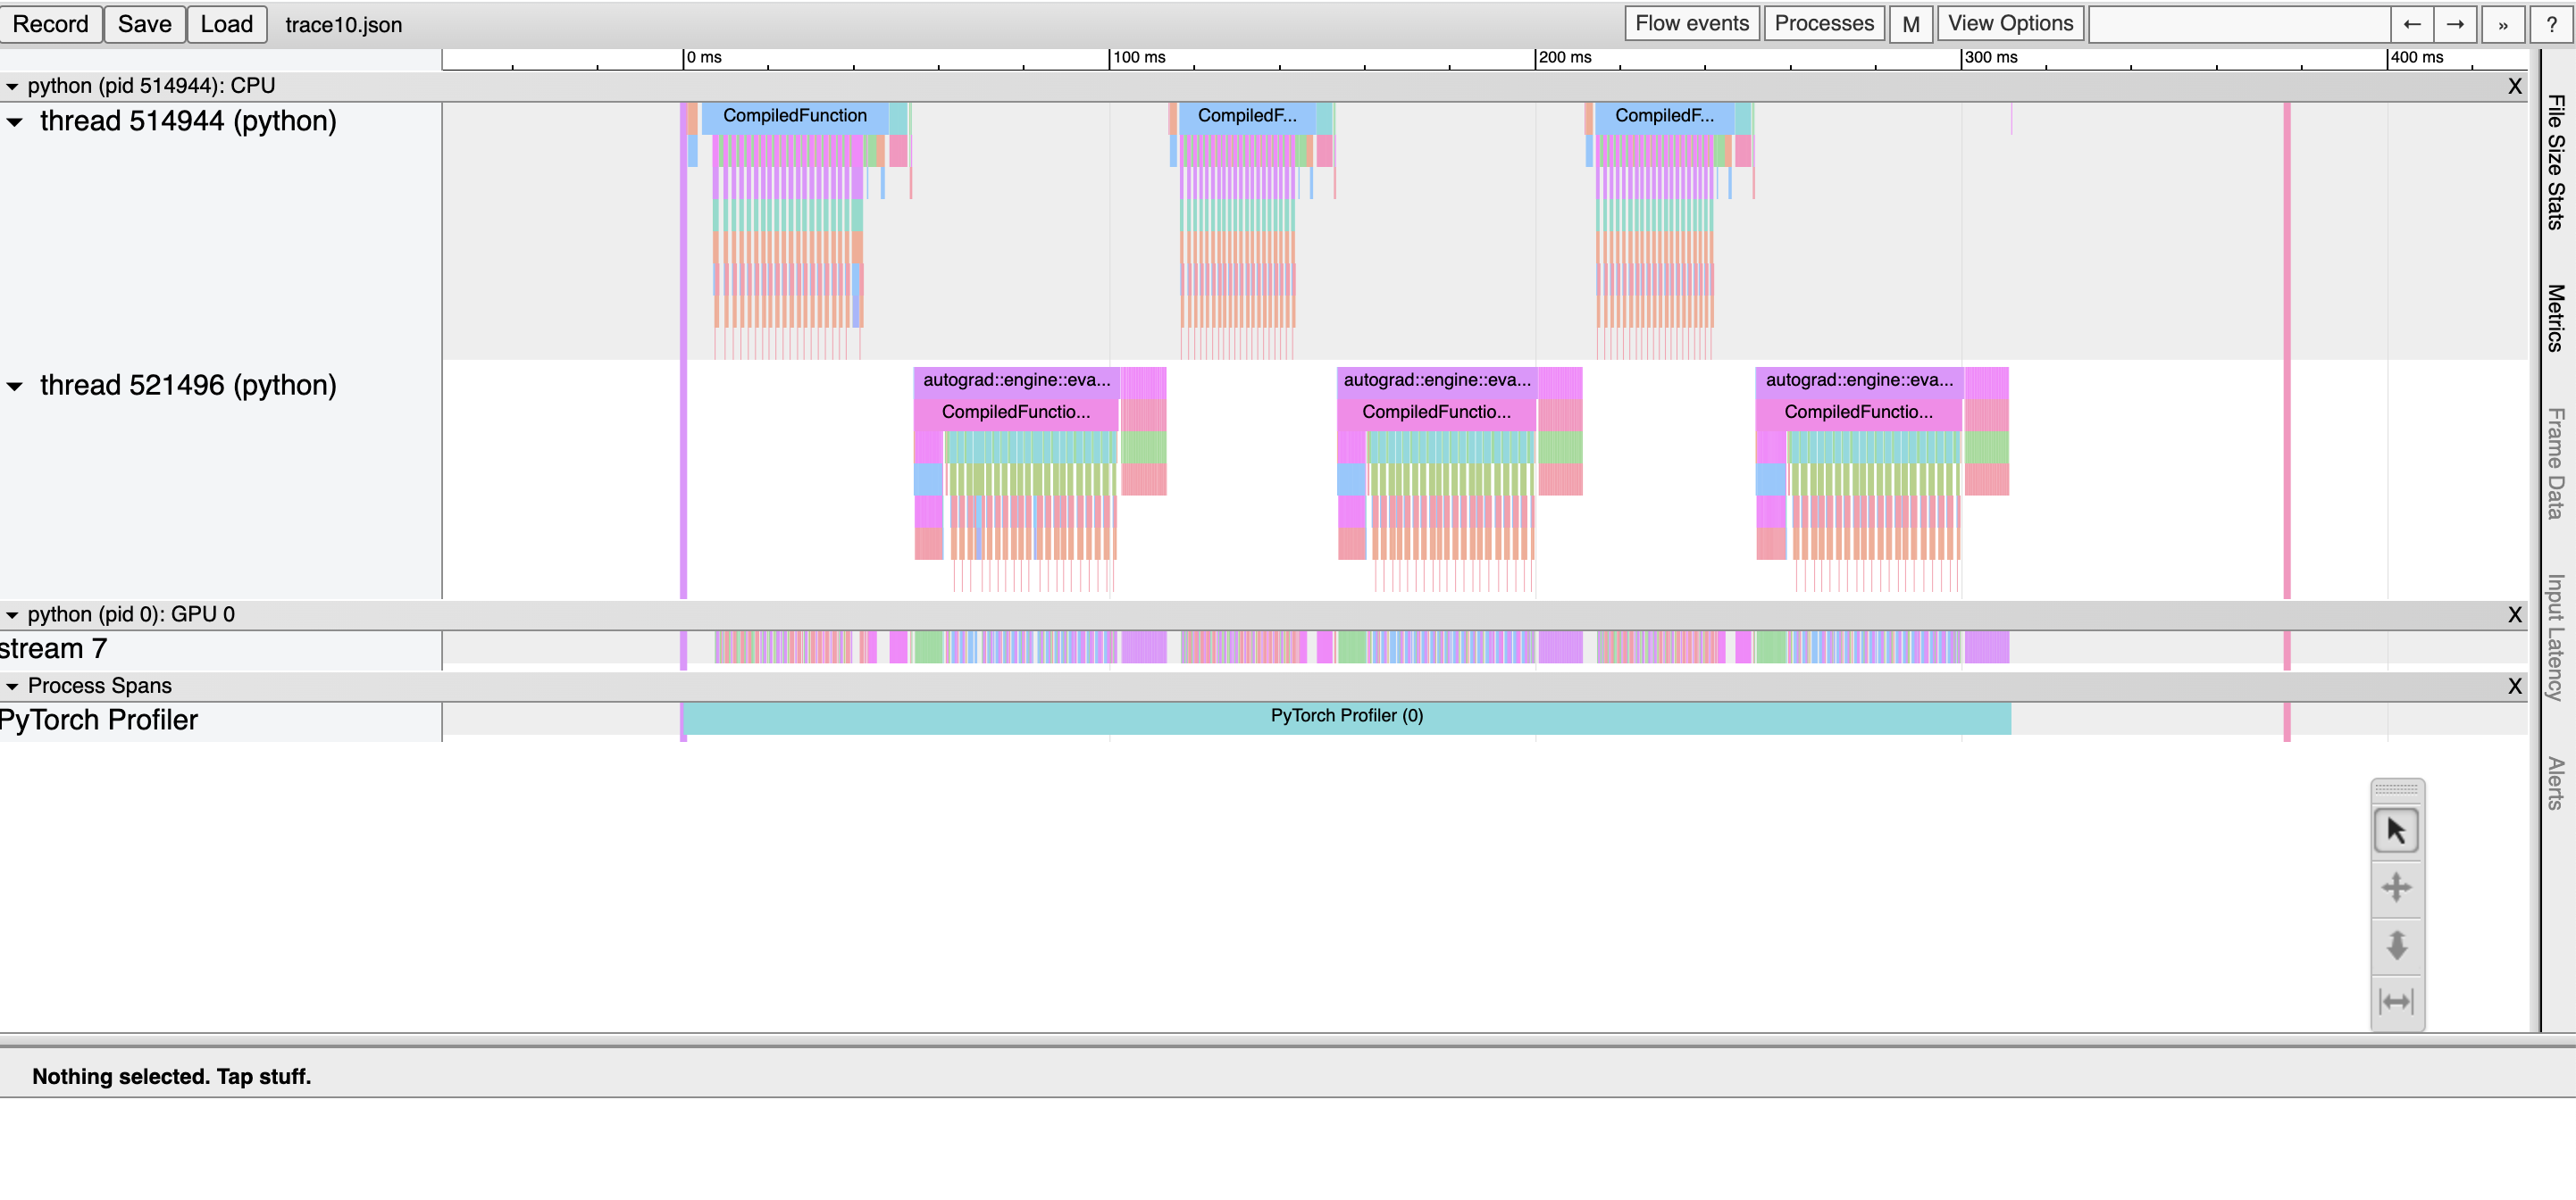
在这里,我们可以观察到:* CompiledFunction 和 CompiledFunctionBackward 事件,它们对应于 dynamo 编译的区域。* 上方显示的是 CPU 事件,下方显示的是 GPU 事件。
CPU和GPU事件间的流量
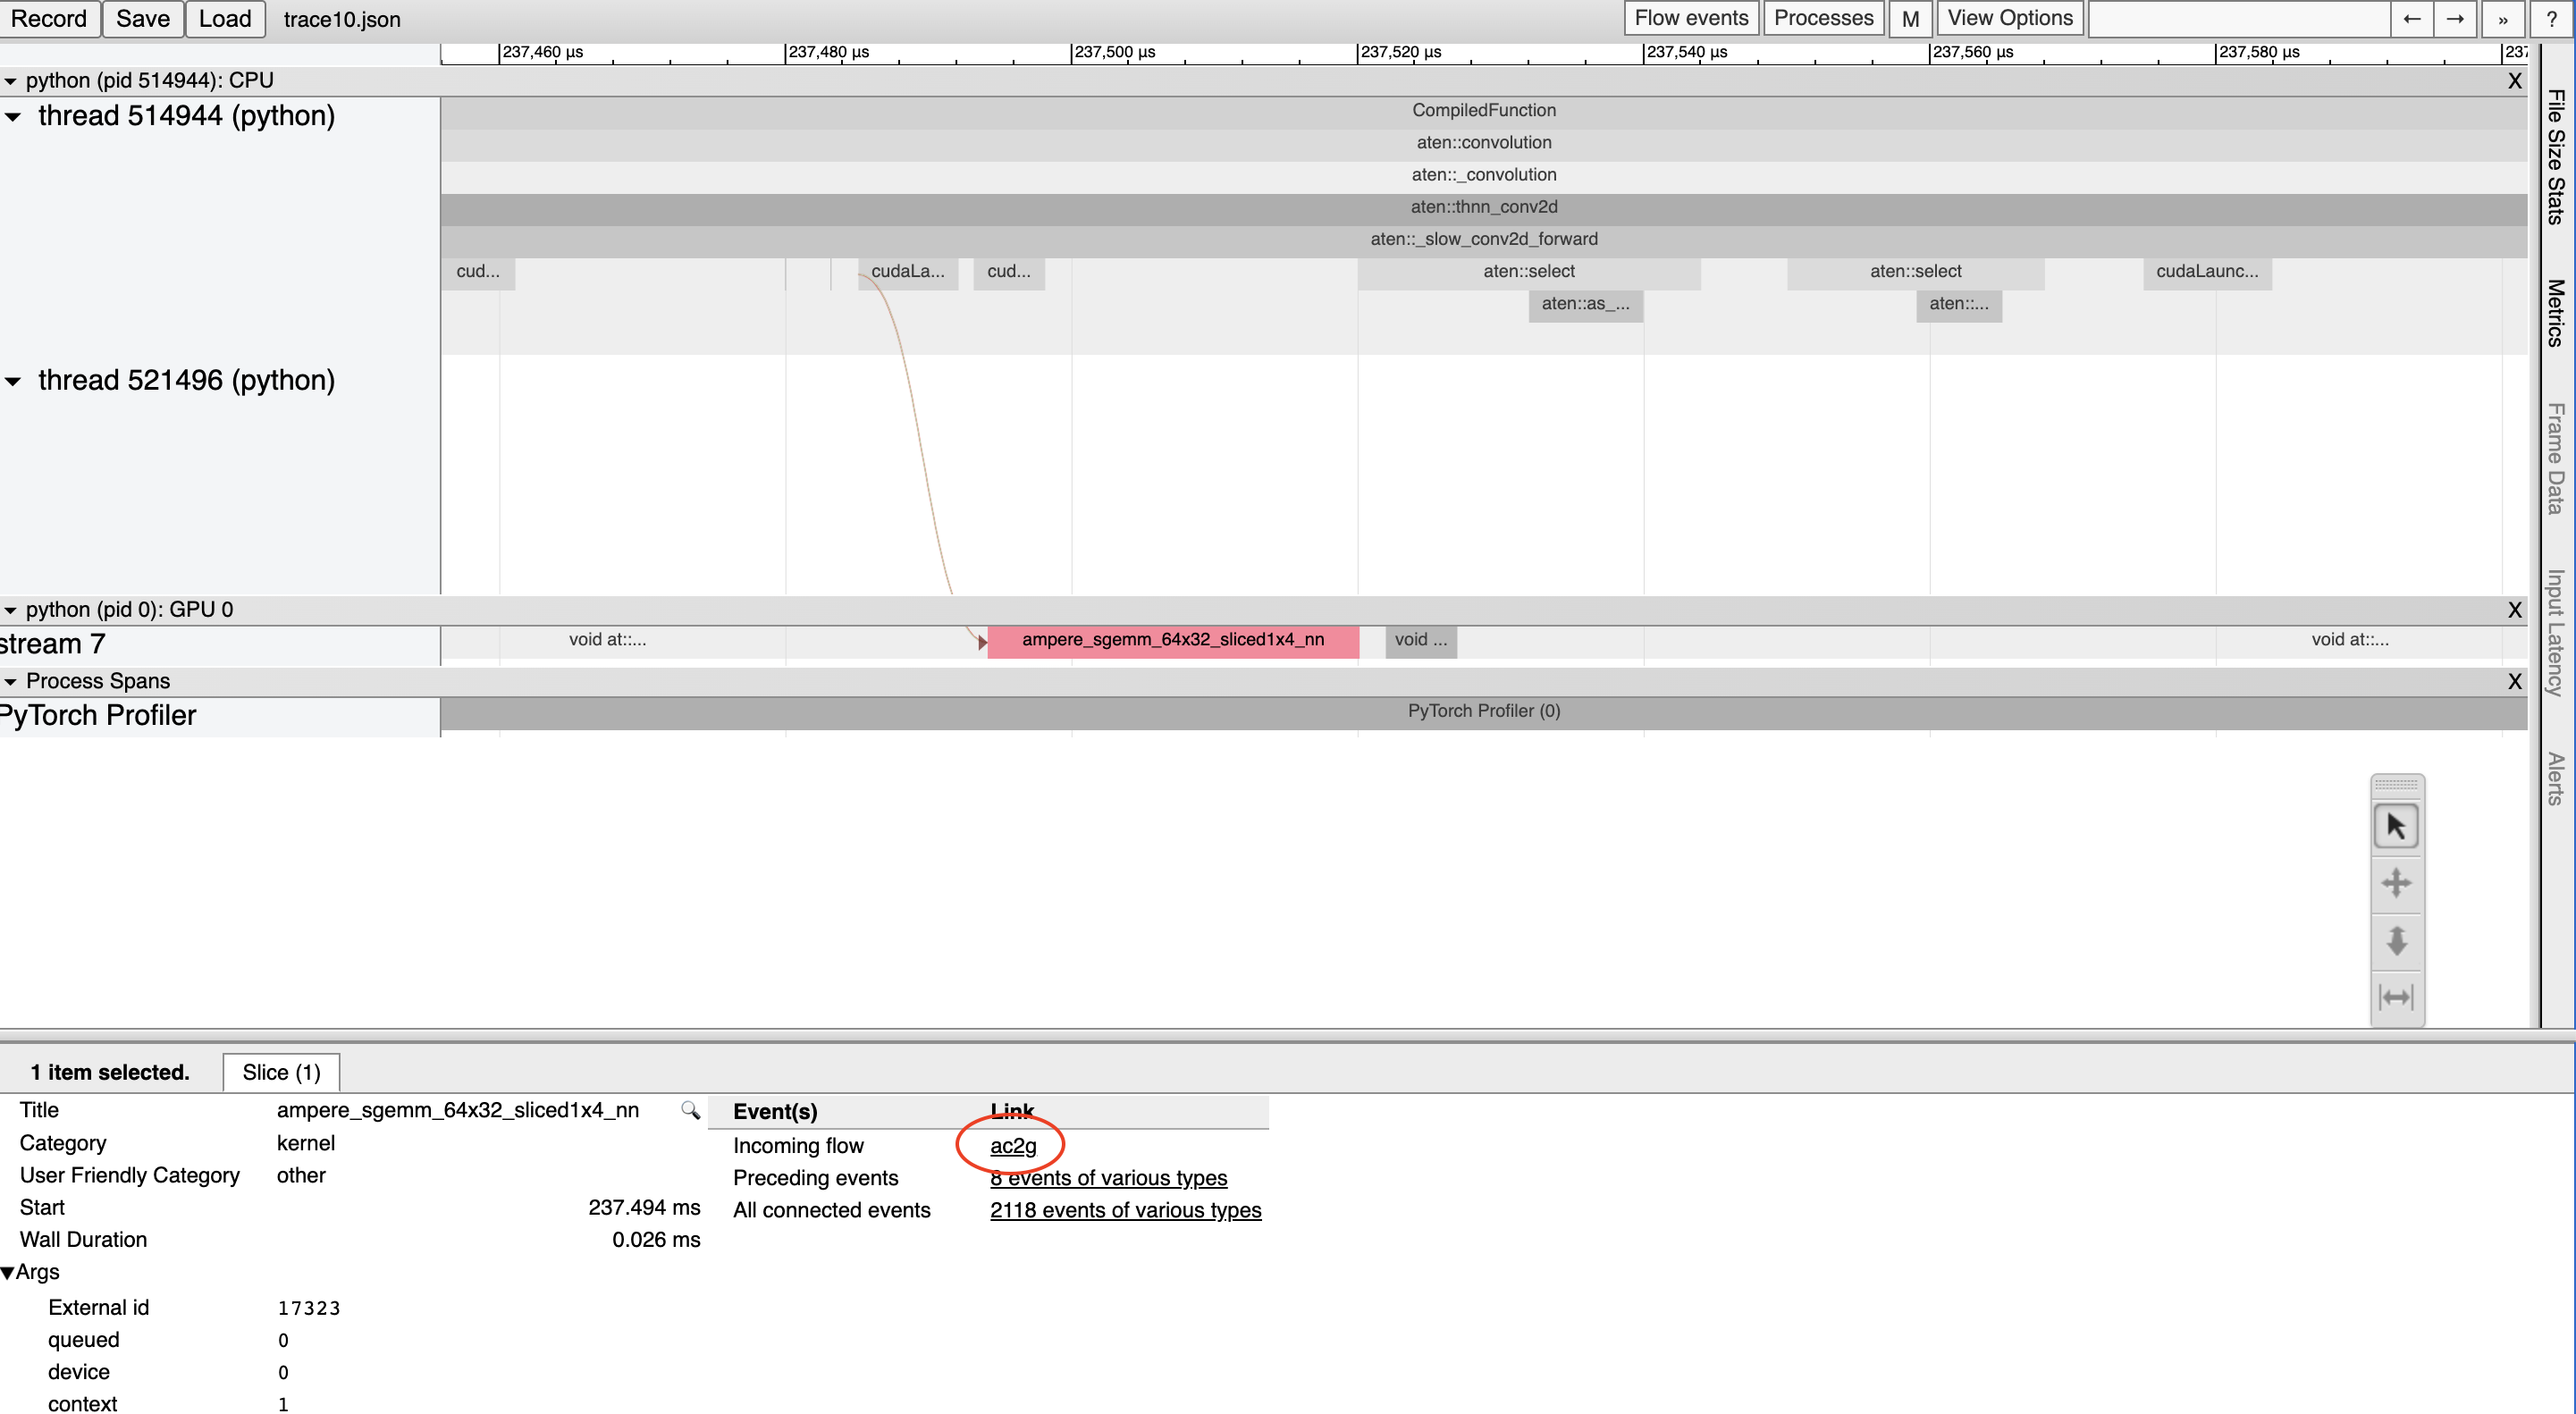
GPU上的每个内核都是在CPU代码启动后运行的。分析工具可以绘制GPU和CPU事件之间的连接(即“流程”),以显示哪个CPU事件启动了相应的GPU内核。这尤其有帮助,因为除了少数例外情况外,GPU内核通常是异步启动的。
要查看流连接,点击一个GPU内核,然后点击“ac2g”:
或者,通过顶部的“流事件”下拉菜单开启所有流。
绕过CUDA图分析问题
当启用CUDA图时,某些CUDA配置(驱动版本低于525.85.12或CUDA版本小于12)可能在性能分析工具和CUDA图之间出现兼容性问题。为了解决这些问题,请在程序开头添加一个空的性能分析上下文:
import torch

torch.profiler._utils._init_for_cuda_graphs()

# ... rest of program
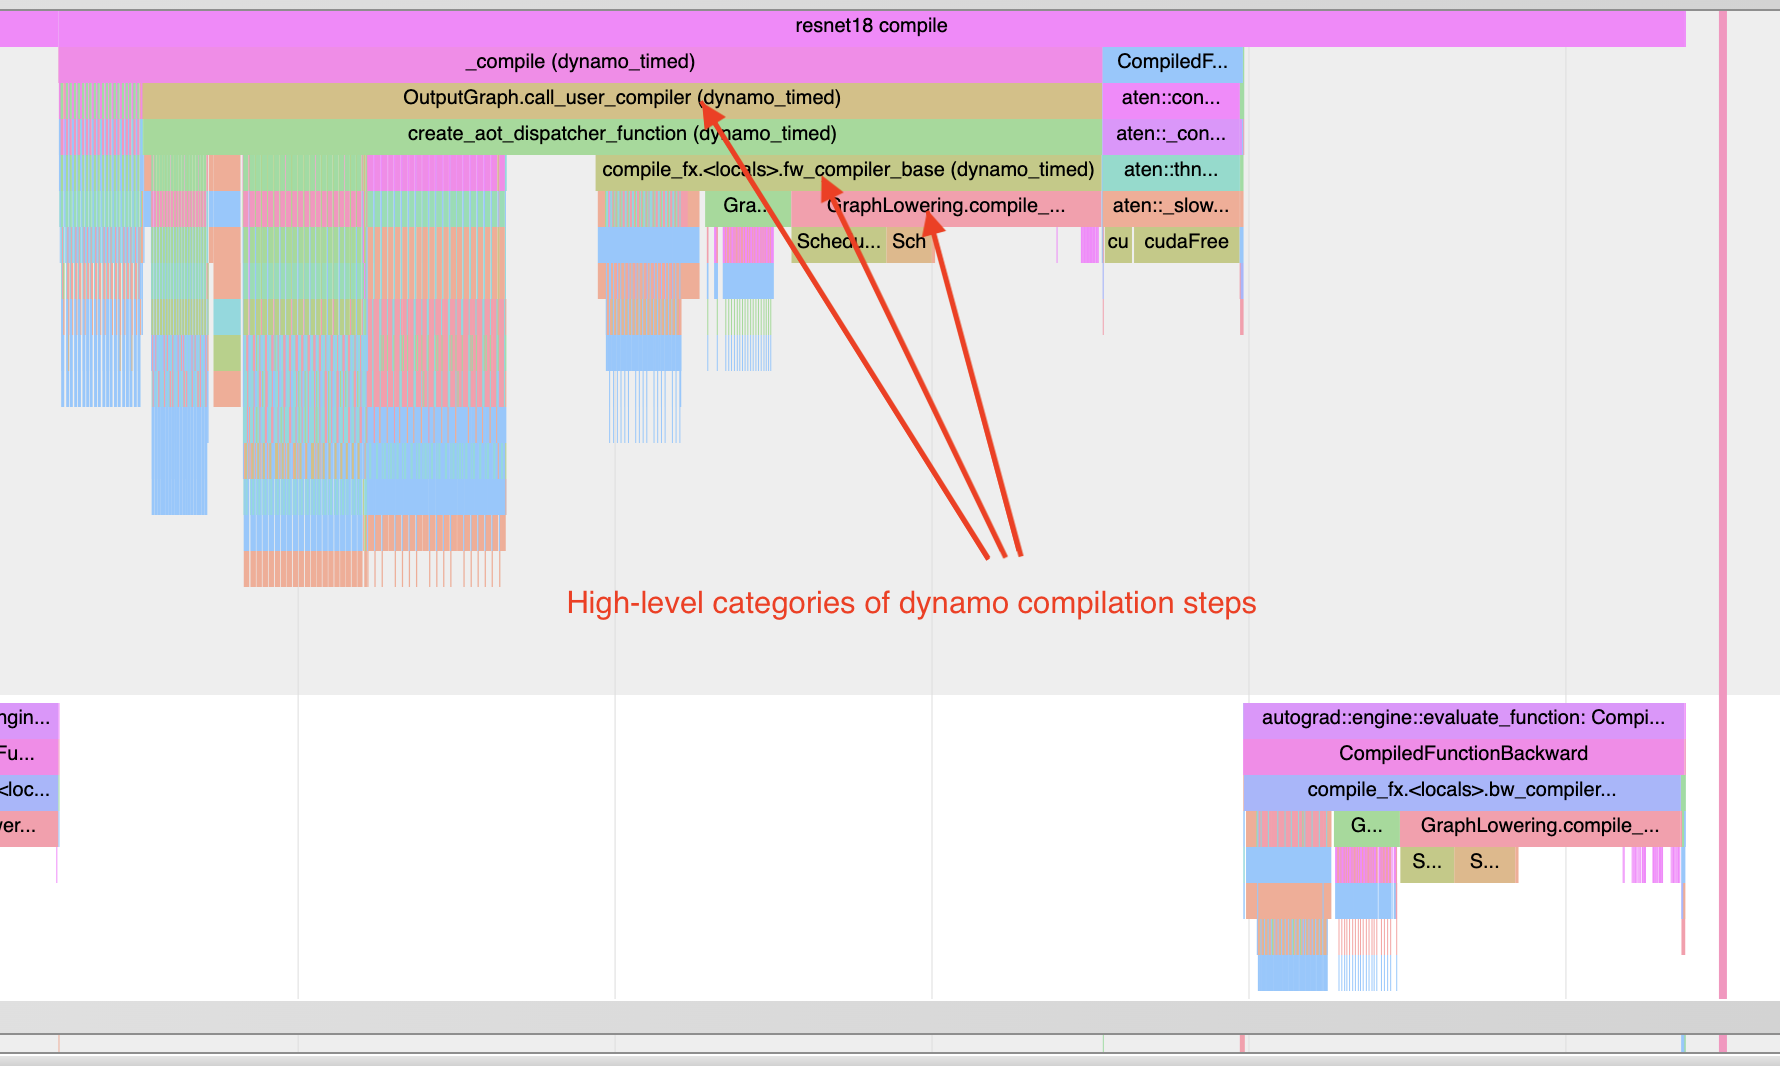
了解编译时间
要了解为什么编译需要很长时间,你可以对一个经过 torch.compile 处理的程序的第一个调用进行性能分析。需要注意的是,编译过程的性能跟踪可能会比典型情况更加扭曲,因为编译工作负载与典型的 PyTorch 工作负载有很大不同。在某些情况下,跟踪文件可能非常大,大于 1GB 的文件可能很难使用 chrome 跟踪工具打开。
注意:也可以使用非图形格式通过 torch._dynamo.utils.compile_times() 获取大致相同的信息。此工具不会显示编译步骤发生的具体时间,但会显示每个步骤所花费的时间,并且这些时间不受任何性能分析开销的影响。
请看以下示例:
import torch
from torchvision.models import resnet18

model = resnet18().cuda()
inputs = [torch.randn((5, 3, 224, 224), device='cuda') for _ in range(10)]

model_c = torch.compile(model)

def fwd_bwd(inp):
    out = model_c(inp)
    out.sum().backward()

def warmup_compile():
    def fn(x):
        return x.sin().relu()

    x = torch.rand((2, 2), device='cuda', requires_grad=True)
    fn_c = torch.compile(fn)
    out = fn_c(x)
    out.sum().backward()

with torch.profiler.profile() as prof:
    with torch.profiler.record_function("warmup compile"):
        warmup_compile()

    with torch.profiler.record_function("resnet18 compile"):
        fwd_bwd(inputs[0])

prof.export_chrome_trace("trace_compile.json")
请注意以下几点:
-
第一次调用应在profiling 进行期间发生,以捕获编译过程。
-
添加一个预编译,以便初始化任何需要延迟初始化的系统。
查找图形中断:「Torch-Compiled Region」和「CompiledFunction」
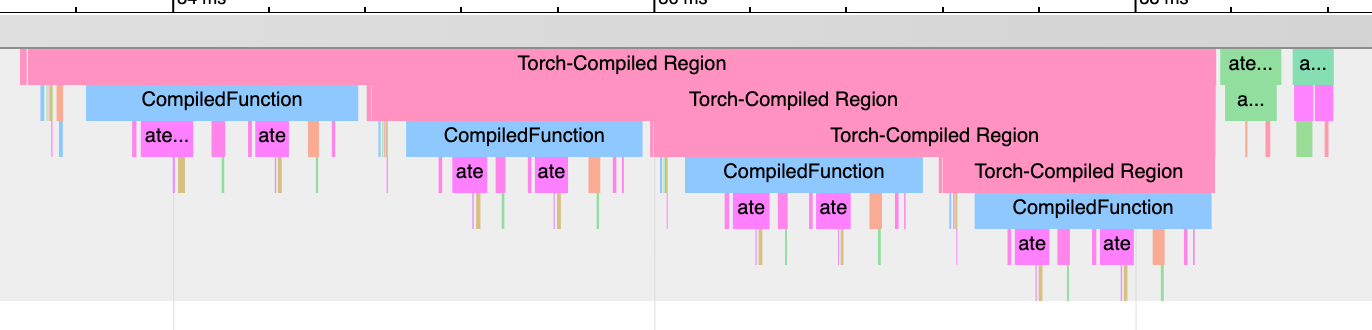
虽然有一些日志工具可以识别图中断,但分析器提供了一种快速的可视化方法来识别图中断。需要关注两个事件:Torch-Compiled Region 和 CompiledFunction。
Torch-Compiled 区域 — 在 PyTorch 2.2 中引入 — 是一种分析事件,涵盖整个编译区域。图中断通常表现为相同的嵌套“Torch-Compiled 区域”事件。
如果你在两个独立的函数上分别应用 torch.compile(),通常你会看到两个相邻(不堆叠、不嵌套)的 Torch 编译区域。如果遇到图中断(或 disable() 了某些区域),则会看到嵌套的“Torch 编译区域”事件。
CompiledFunction - 在 PyTorch 2.0 中引入 - 是一个剖析事件,在任何输入需要计算梯度时触发。每当图中断发生时,都会打断一个 CompiledFunction 块,并将其分成两部分。只有在 Autograd 参与的情况下(即图中某些输入张量的 requires_grad 属性为 True)才会出现 CompiledFunction 事件。
当编译函数(CompiledFunction)出现在跟踪记录中时,它通常会在反向传递过程中与一个 CompiledFunctionBackward 事件配对。如果调用了反向函数,则在跟踪记录中应该会有一条连接两者的“前向-后向链接”。
如果你的用例中有一个不需要计算梯度并且没有包含“Torch-Compiled Region”事件的图,可能会更难判断torch.compile是否被正确应用。一个提示是是否存在由Inductor生成的Triton内核。
请参看以下合成示例进行演示:
import torch
import torch._dynamo

class ModelWithBreaks(torch.nn.Module):
    def __init__(self):
        super().__init__()
        def create_sequential():
            return torch.nn.Sequential(
                torch.nn.Linear(128, 128),
                torch.nn.ReLU(),
                torch.nn.Linear(128, 128),
                torch.nn.ReLU(),
            )
        self.mod1 = create_sequential()
        self.mod2 = create_sequential()
        self.mod3 = create_sequential()
        self.mod4 = create_sequential()

    def forward(self, inp):
        mod1 = self.mod1(inp)
        torch._dynamo.graph_break()
        mod2 = self.mod2(mod1)
        torch._dynamo.graph_break()
        mod3 = self.mod3(mod2)
        torch._dynamo.graph_break()
        mod4 = self.mod4(mod3)
        return mod4


model = ModelWithBreaks().cuda()
inputs = [torch.randn((128, 128), device='cuda') for _ in range(10)]

model_c = torch.compile(model)

def fwd_bwd(inp):
    out = model_c(inp)
    out.sum().backward()

# warm up
fwd_bwd(inputs[0])

with torch.profiler.profile() as prof:
    for i in range(1, 4):
        fwd_bwd(inputs[i])
        prof.step()

prof.export_chrome_trace("trace_break.json")
操作符核心
当操作符启动时,我们期望看到一些事件:
-
CPU侧的事件
-
启动内核(如果是针对GPU的内核)
-
GPU事件
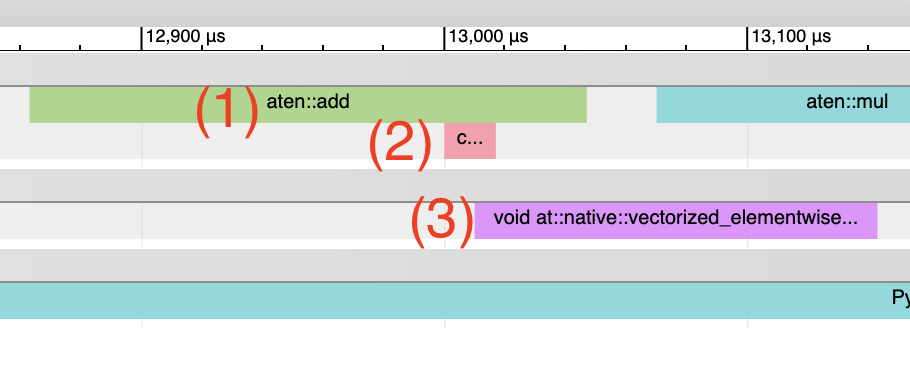
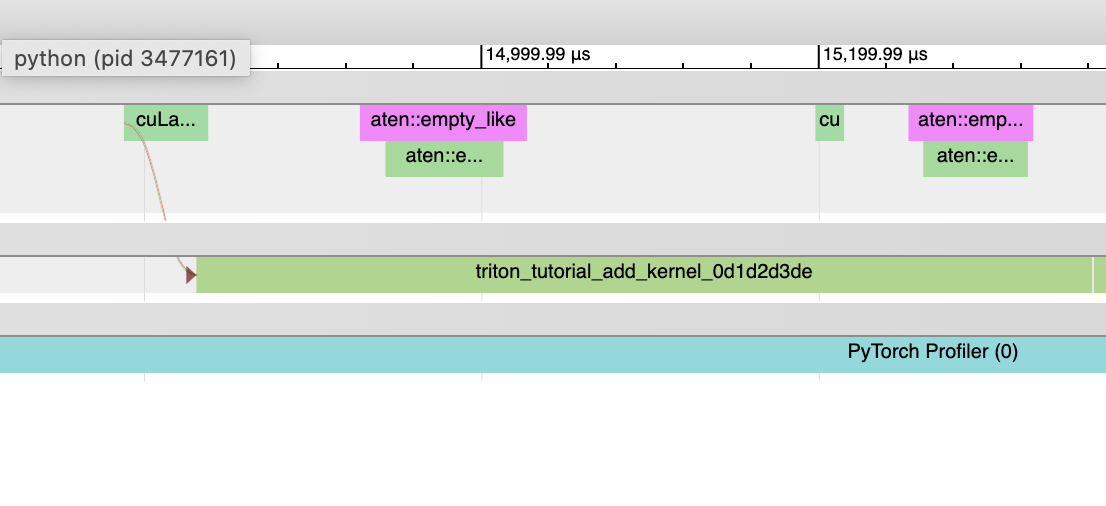
由电感器生成的Triton内核: 1. CPU端事件 应以“triton_”为前缀出现,当前仅包含内核名称和启动信息,比典型的aten内核启动(包含输入形状、类型等)要少。2. 内核启动 应显示为cuLaunchKernel而不是cudaLaunchKernel(cudaLaunchKernel通常是aten操作的典型情况)。3. GPU端事件 应该出现,其名称描述性取决于电感器配置中的unique_kernel_names设置。
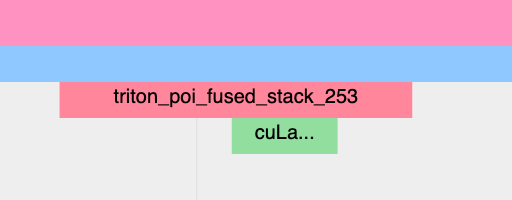
非由Inductor生成的Triton内核:
-
CPU端的事件可能不会出现在跟踪中;因为自动插入分析事件的功能目前只在 Inductor 层级实现,所以绕过 Inductor 的 Triton 内核可能不会出现在跟踪中,除非用户手动添加了注释。
-
应将内核启动显示为cuLaunchKernel,而不是cudaLaunchKernel(cudaLaunchKernel通常用于aten操作)
-
你应该能看到GPU端的事件出现,其名称与所编写的Triton内核相似。
由电感生成的CPU内核:
-
CPU侧事件 不会出现在跟踪中;我们还未对此进行性能分析。
-
没有内核启动 和 GPU端事件
非Triton内核(例如 aten 内核或自定义操作)也可能出现在跟踪记录中。有时候,Inductor 会回退到原始的操作实现,在这种情况下,你将会看到对 aten 操作的调用。
启动成本
一个常见问题是 GPU 利用率低。可以通过观察 GPU 上的内核之间是否存在较大间隙来快速识别这个问题:

这通常是由于CPU开销导致的,例如,在两次内核启动之间,CPU上花费的时间比GPU处理这些内核所用的时间还要长。对于小批量数据来说,这种情况更常见。
在使用线圈时,启用 CUDA 图可以经常在启动开销较大时帮助提升性能。